Other names for the Riva Service Monitor:
| Name |
Location |
| CRM Service Monitor |
Riva 2.4.46 or earlier. |
| Riva CRM Service Monitor |
Various Knowledge Base articles. |
| Riva CRM Monitor |
| CRM Monitor |
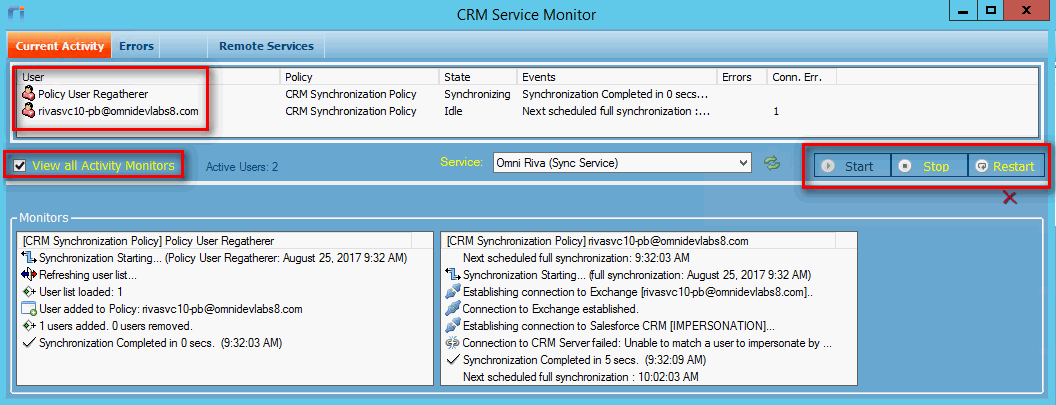
The Riva Service Monitor is a Windows application that is used to monitor the sync activity of target users. Because it can display Activity Monitors for selected target users, it is one of the primary sync troubleshooting tools used to spot errors and confirm sync status and health.
Current Activity Page
- Displays the user sync queue; that is, displays the users in the chronological order of their sync schedule.
- Displays, for every user, the sync policy related to the user, the sync state, the current or next scheduled event, and the error count.
- Provides the ability to view Activity Monitors for all or selected target users in the sync queue. All errors that occur are displayed in the user's Activity Monitor.
- Provides the ability to start, stop, or restart the CRM Agent service.

Viewing Activity Monitors
To view all the users in Activity Monitors:
-
Select the View all Activity Monitors check box.
Note: In Riva 2.4.44 or higher, by default, the Riva Service Monitor displays a maximum of 200 Activity Monitors. That maximum is in place, because in previous versions, attempting to view more than 200 activity monitors at a time sometimes caused the Riva Service Monitor to become unresponsive.
Tip: (Riva 2.4.44 or higher.) For greater performance, limit the maximum number of displayed activity monitors to a number below 200.
To set the maximum number of Activity Monitors that can be displayed in Riva 2.4.44 or higher:
To view selected users in Activity Monitors:
-
On the Current Activity page, clear the View all Activity Monitors check box.
All the Activity Monitors disappear, and a check box appears in front of every user on the list.
-
For every user that you want to see in an Activity Monitor, select the check box in front of the user.
Note: (Riva 2.4.44 or higher.) If selecting a user were to exceed the set maximum number of Activity Monitors, a warning appears.
Errors Page

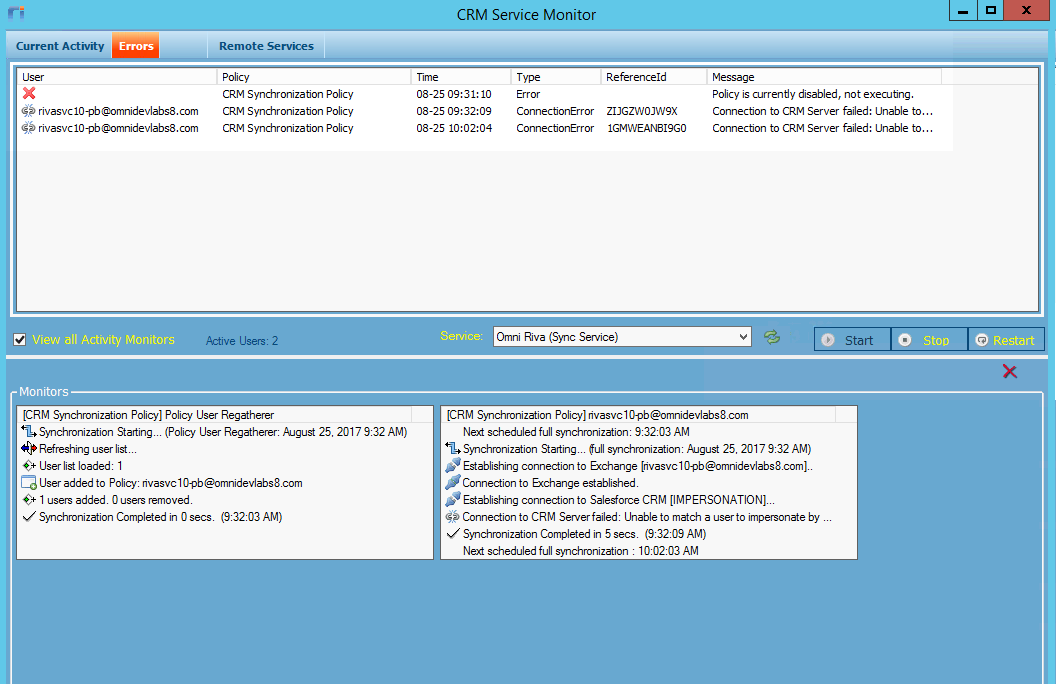
The Errors page provides the ability to
- View a list of all reported data sync errors, also called sync-critical errors.
- Sort the list by target user.
- Query the list for specific errors.
- Clear the list without having to restart the application.
- Obtain a data sync error object ID value that can be used to find the instance of the specific data sync error in the crmex-log file in the Riva\Logs folder. For more information on log files, see Manage Riva server logging.
Remote Services Page
Available in Riva 2.4.41 or higher. For information, see Remote management.
Starting the Riva Service Monitor
The way to start the monitor depends on the installed version of Riva:
-
Riva 2.4.52 or higher: In the Riva Manager application, on the menu bar, select  Service Monitor.
-
Riva 2.4.47 or higher: In the Riva installation folder, open or run the "Riva Service Monitor.cmd" file.
-
Riva 2.4.46 or earlier: In the Riva installation folder, open or run the "CRM Service Monitor.cmd" file.
Notes
-
If the Riva Service Monitor is open when a sync policy is modified and saved, the user sync queue is refreshed and the sync cycles are restarted.
-
If the Monitor is opened while the service is actively syncing target users, the user sync queue may not become visible until a new sync cycle starts for the first user in the sync queue.
-
The Monitor writes a record of its own activity (for example, the time it started) to a set of "crmmon" log files stored in the Riva\Logs folder. For more information on log files, see Manage Riva server logging.


