In Riva Cloud, the Metrics page displays two groups of values related to the sync.
Table Near the Top
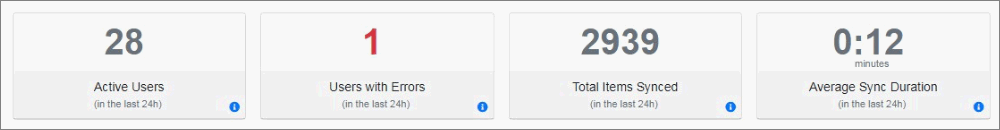
Near the top of the Metrics page in Riva Cloud, a table displays metrics and one calculation.
- In Riva Cloud Company, the data apply to the syncing admin or end user who logged in. A syncing admin can use impersonation to view an end user's metrics.
- In Riva Cloud Corporate, the table displays the aggregate metrics and one calculation for all syncing users, including syncing admins.
The screen shot is taken from Riva Cloud Corporate. In Riva Cloud Company, the table would look much the same, except that the number of active users would be 1 or 0. Explanations follow the table.
|
Definitions |
Notes |
| Active Users |
The total number of users who were enabled to sync and were part of an active policy, in the last 24 hours.1 |
In Riva Cloud Corporate, this number is less than the number of licensed users if some licensed users were not enabled to sync at all in the last 24 hours.1
In Riva Cloud Company, this number is 1 or 0. (0 if the user was not enabled to sync in the last 24 hours.1 |
| Users with Errors |
The total number of users who had any type of error and/or warning, for example email and/or CRM connection errors, in the last 24 hours.1 |
In Riva Cloud Company, this is 0 or 1. The table applies to only one user.
A warning does not prevent syncing an item or user.
To view errors and warnings, refer to the sync logs. |
| Total Items Synced |
The total number of items created, updated, deleted, or otherwise changed by Riva for all active users on the policy, in the last 24 hours.1 |
For a breakdown of the number of items, see the doughnut charts. |
| Average Sync Duration |
The average duration in m:ss (minutes:seconds) of the sync cycles that have taken place in the last 24 hours.1 |
This metric excludes the duration of cycles that were manually initiated by an admin. |
- The 24 hours are counted from the time the Metrics page is accessed or refreshed.
Below the top table, there are doughnut charts.
Doughnut Charts
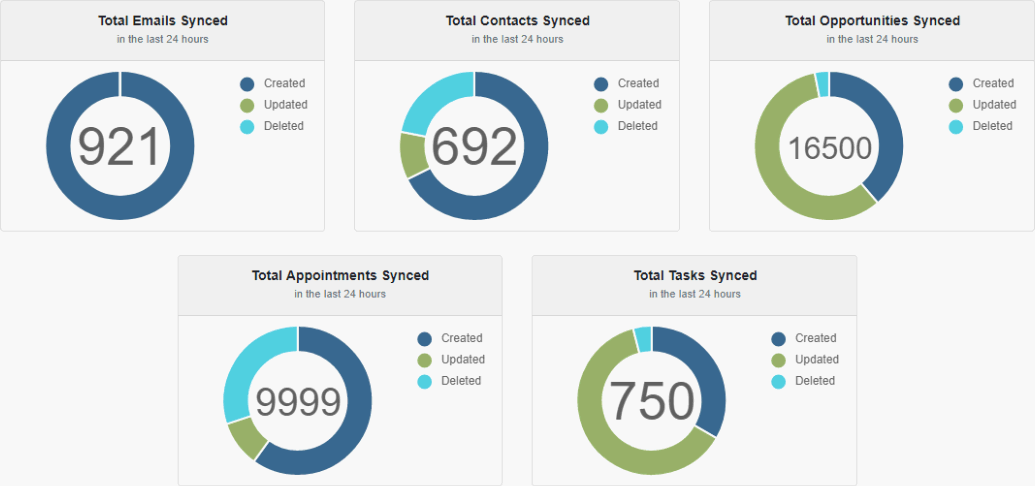
The sync doughnut charts appear near the bottom of the Metrics page. They provide a breakdown of the total number of items synced. Each doughnut chart shows data for one synced module. Here is an example followed by explanations.
Users included on the doughnut charts:
-
In Riva Cloud Company, the doughnut charts include only an end user, a syncing admin, or an end user impersonated by an admin.
-
In Riva Cloud Corporate, by default, the data for all the active users on the policy is included on the doughnut charts, but you can restrict the display to include only one or a few users.
To select one or more Riva Cloud Corporate users to see only their metrics on the doughnut charts:
-
Just above the doughnut charts, click inside the User Filter field, and select a user from the list or type the first few characters of a user's name and select it.
-
Repeat step 1 until you have selected all the users that you want to view the aggregate numbers of.
-
To the right of the User Filter field, select Apply.
Breakdown by the type of changes:
- The number displayed on a doughnut chart is the aggregate number of items created, updated, or deleted by Riva for that module for the user or users in the last 24 hours. (The 24 hours are counted from the time the Metrics page is accessed or refreshed.) As shown on the screen shot, the colour coding on the chart distinguishes between created, updated, and deleted items.
Accessing the Metrics Page
Availability of the Metrics page:
- Riva Cloud Corporate: only admins.
- Riva Cloud Company: end users and admins (to view their own metrics). By using impersonation, admins can access any other user's Metrics page.
To access the Metrics page: