Prerequisites and Notice
An existing understanding of Splunk is required in order to proceed with the following steps. Splunk provides extensive training and certifications for deploying and managing Splunk.
Riva does not provide technical support, training, or any customization services for Splunk.
If assistance is required with Splunk, contact Splunk Professional Services or Splunk Technical Support.
Splunk via Universal Forwarder (UF)
Applies to Riva On-Premise, all versions.
The Splunk Universal Forwarder supports monitoring of the file system for log files. The Riva log files can be collected by the UF.
For details on the file system logging and the file name format, see How to manage Riva server logging.
In Riva 2.4.54 or higher, the sync policy can be configured to prevent Personally Identifiable Information (PII) from appearing in Splunk logs.
Splunk via HTTP Event Collector (HEC)
Applies to Riva On-Premise 2.4.45 or higher.
Support for Splunk Enterprise and Splunk Cloud.
In Riva 2.4.54 or higher, the sync policy can be configured to prevent Personally Identifiable Information (PII) from appearing in Splunk logs.
Prerequisites, Notice, and Procedures
- Create the collector's information.
- Configure the Splunk Appender.
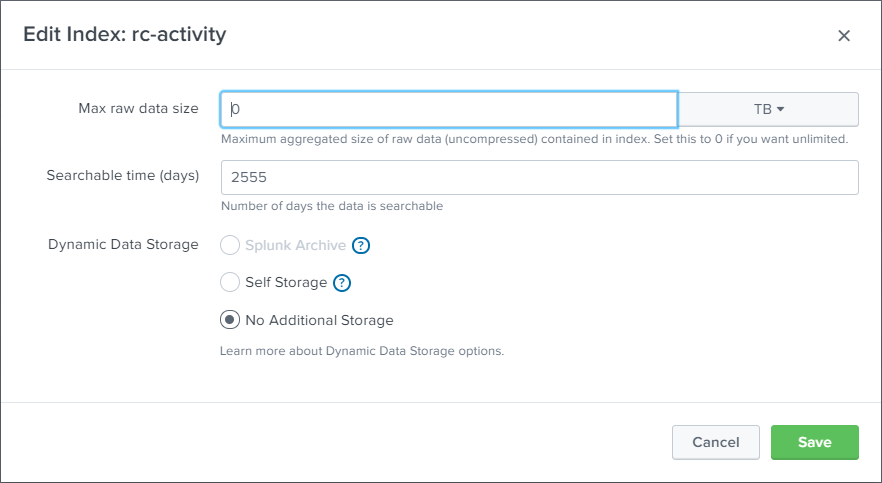
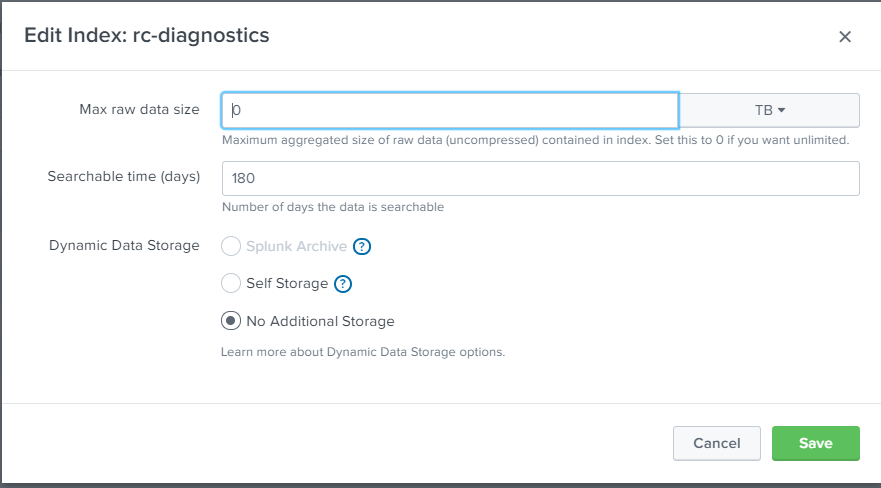
Create Indexes in Splunk for activities and diagnostics as provided in the below screen shots.
Step 1: Create the Collector's Information
-
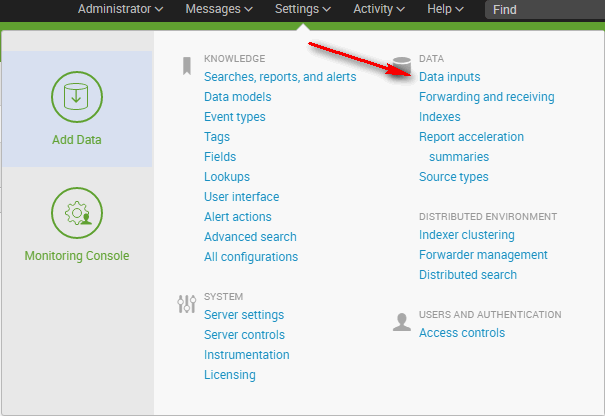
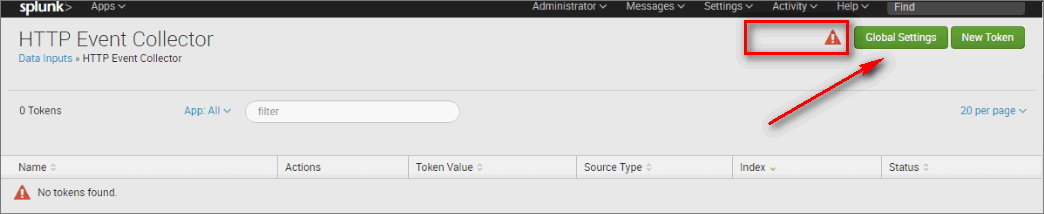
In Splunk, select Data Inputs.
-
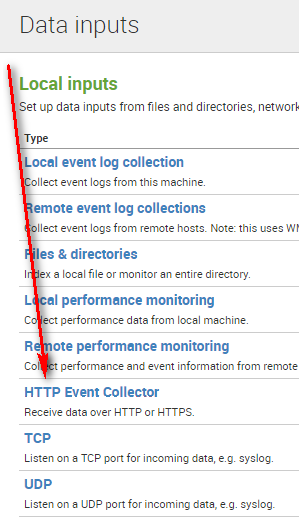
Select the Http Event Collector handler.
A list displays all of this instance's collectors. The red flag indicates that tokens are currently disabled anyway.
-
Select Global Options.
-
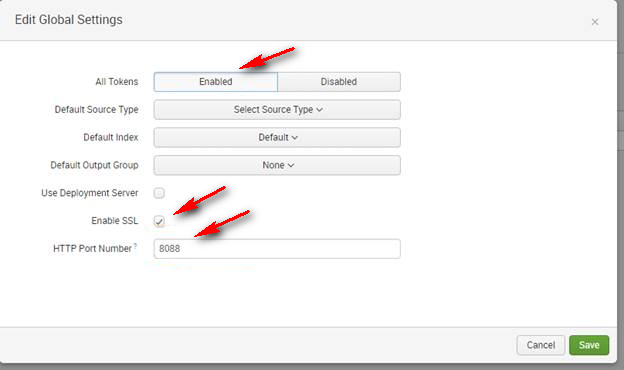
In the Edit Global Settings window, do as follows:
- Enable All Tokens.
- If you want your communications to use HTTPS, select the Enable SSL check box.
- Best Practice: HTTPS is always recommended.
- Enter the HTTP Port Number that will be used for communications. (Default: 8088.)
-
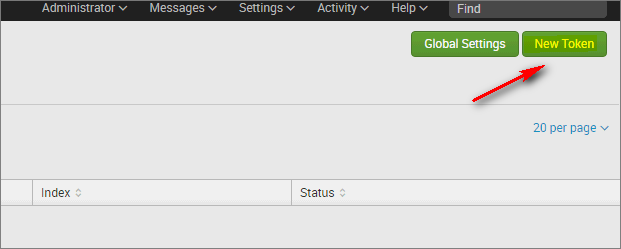
In the HTTP Event Collector window, in the top right corner, select New Token to configure the collector to use.
-
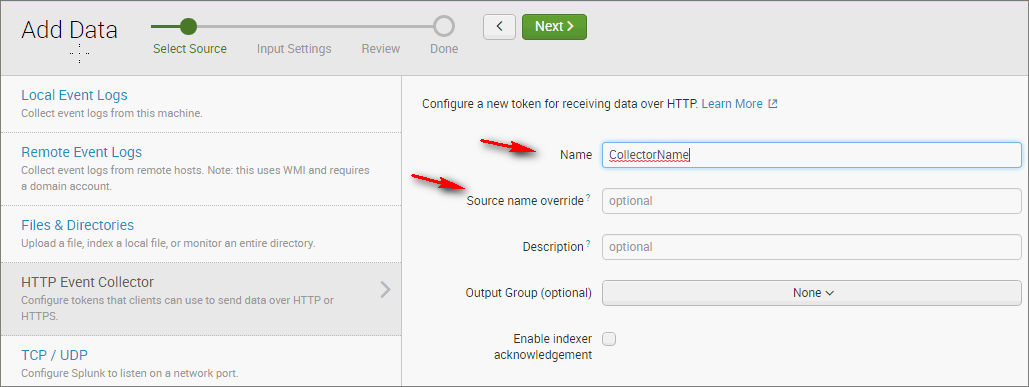
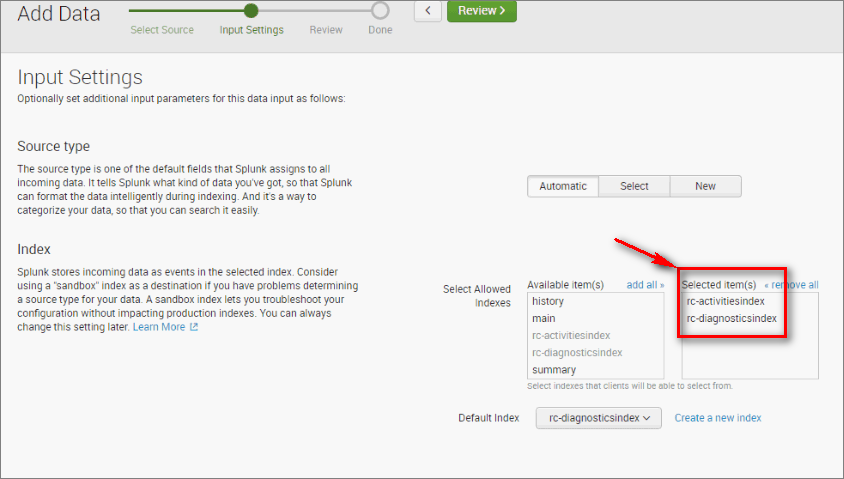
In the Add Data window, in the Name field, enter the collector's name. Optionally enter the Source name. At the top of the window, select Next.
-
Select the indexes that need to be covered by this collector. At the top of the window, select Review.
-
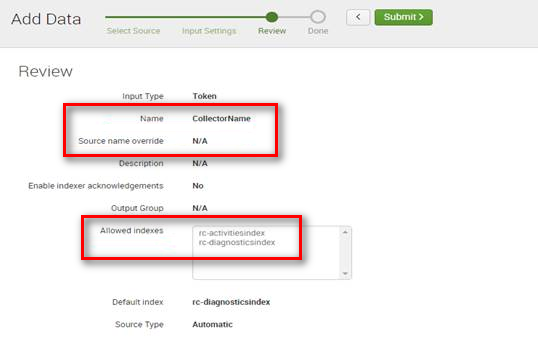
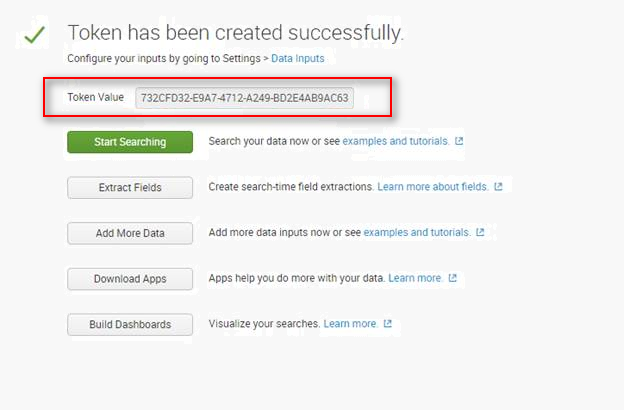
Review the Collector's info, and select Submit to create the collector.
The token value is displayed.
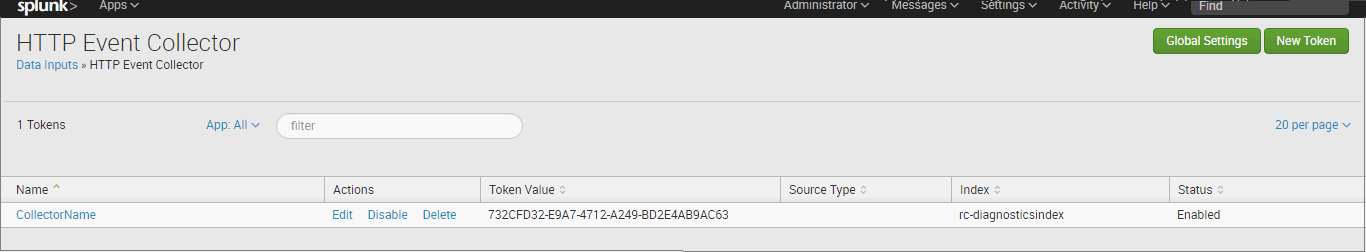
The collector's information is listed in the HTTP Event Collector view.
Step 2: Configure the Splunk Appender
In the App config, do as follows:
-
Describe the OmniSplunkAppender and CrmSlpunkAppender in <Configuration>/<configSections>:
<configSections>
<sectionGroup name="splunkAppender">
<section name="omniSplunkAppender" type="Omni.Logging.Configuration.SplunkAppenderConfigSection, Omni.Logging, Culture=neutral"/>
<section name="crmSplunkAppender" type="Omni.Logging.Configuration.SplunkAppenderConfigSection, Omni.Logging, Culture=neutral"/>
</sectionGroup>
</configSections>
-
In <Configuration>/<configSections>, specify the connectionStrings to be used by each appender.
<splunkAppender>
<omniSplunkAppender isEnabled="true" connectionStringName="connection_splunk_diagnostics" />
<crmSplunkAppender isEnabled="true" connectionStringName="connection_splunk_activities" />
</splunkAppender>
-
Create a connection string for the Activity and Diagnostic indexes that were created:
<add name="connection_splunk_diagnostics" connectionString="Data Source=https://localhost:8088/services/collector/event;Compact=true;UseSmart=false;Token=GET FROM SPLUNK STEP 8;Index=rc-diagnosticsindex;SourceName=default" providerName="Splunk" />
Example:
<add name="connection_splunk_activities" connectionString="Data Source=https://localhost:8088/services/collector/event;Compact=true;UseSmart=false;Token=GET FROM SPLUNK STEP 8;Index=rc-activitiesindex;SourceName=default" providerName="Splunk" />
- Name: The name of the connectionstring used at step 2.
- connectionString: Describe all the collector's info needed to communicate.
- Data Source: [Protocol]://[Host]:[Port]/Services/Collector/event
- Protocol: HTTP / HTTPS, depending on the global options of the instance that were specified at step 4 in Administration.
- Best Practice: HTTPS is always recommended.
- Host: The host of the Splunk instance. Examples: localhost, 10.10.10.10.
- Port: The port used by the Splunk services, as specified at step 4 in Administration.
- Compact: When set to true, removes unnecessary information.
- UseSmart: When set to true, replaces some of the long event lines with shorter ones.
- Token: The collector's token displayed after step 8 in Administration.
- Index: The Splunk index that this appender will use.
- SourceName: The collector's source, as specified at step 4 in Administration. In case it was not specified, use default.
- providerName: Splunk.
Note: The parameters can be placed in any order.
